Deconstructing Emergent: The Complete Institutional Report on the AI-Native App Engine Hypetrics Desk July 28, 2026
Deconstructing Emergent: The Complete Institutional Report on the AI-Native App Engine Hypetrics Desk
The Hard Engineering Stack: Deconstructing LAT Aerospace’s Triple-Program Architecture Hypetrics Desk
Deconstructing Emergent: The Complete Institutional Report on the AI-Native App Engine Hypetrics Desk July 28, 2026
The Hard Engineering Stack: Deconstructing LAT Aerospace’s Triple-Program Architecture Hypetrics Desk July 27, 2026
Hakimo’s Funding Signals the Rise of AI-Led Physical Security Operations, Raises $12M Hypetrics Desk July 11, 2026
The Technical Infrastructure Index: Benchmarking Precision Engineering, Localized Tooling, and Capital Optimization Models Hypetrics Desk June 24, 2026
InventoryQuant Within the Shift Towards Automated Inventory Structuring in Insurance Hypetrics Desk May 4, 2026
How Drunk Elephant Aligned With the Shift Towards Ingredient-Based Decision Filters Hypetrics Desk April 28, 2026
NZXT strategies distribution in India along with Redington India and Technology & Gadgets (TAG). Hypetrics Desk April 1, 2026
Lahori Zeera – From Regional Beverage to 5 Lakh+ Retail Touchpoints in India Hypetrics Desk August 21, 2025
Mia by Tanishq Ramps Up Retail Expansion,75 New Stores by FY25, 1 Million Customers in Sight by FY28 Hypetrics Desk July 30, 2025
CureFit Secures $2M in Flat Round Ahead of IPO; Maintains $1.6B Valuation Hypetrics Desk July 23, 2025
Musician Badshah Launches ‘Badboy Pizza’ Eyes 50 Outlets Across India and ₹150 Cr ARR in 3 Years Hypetrics Desk July 12, 2025
From Values to Valuation — Is Sridhar Vembu Rewriting the Rules of Tech Success? hypetrics April 10, 2025
Meesho to go public with $ 1 billion IPO, Aims for an ambitious valuation of $ 10 billion. Hypetrics Desk March 25, 2025
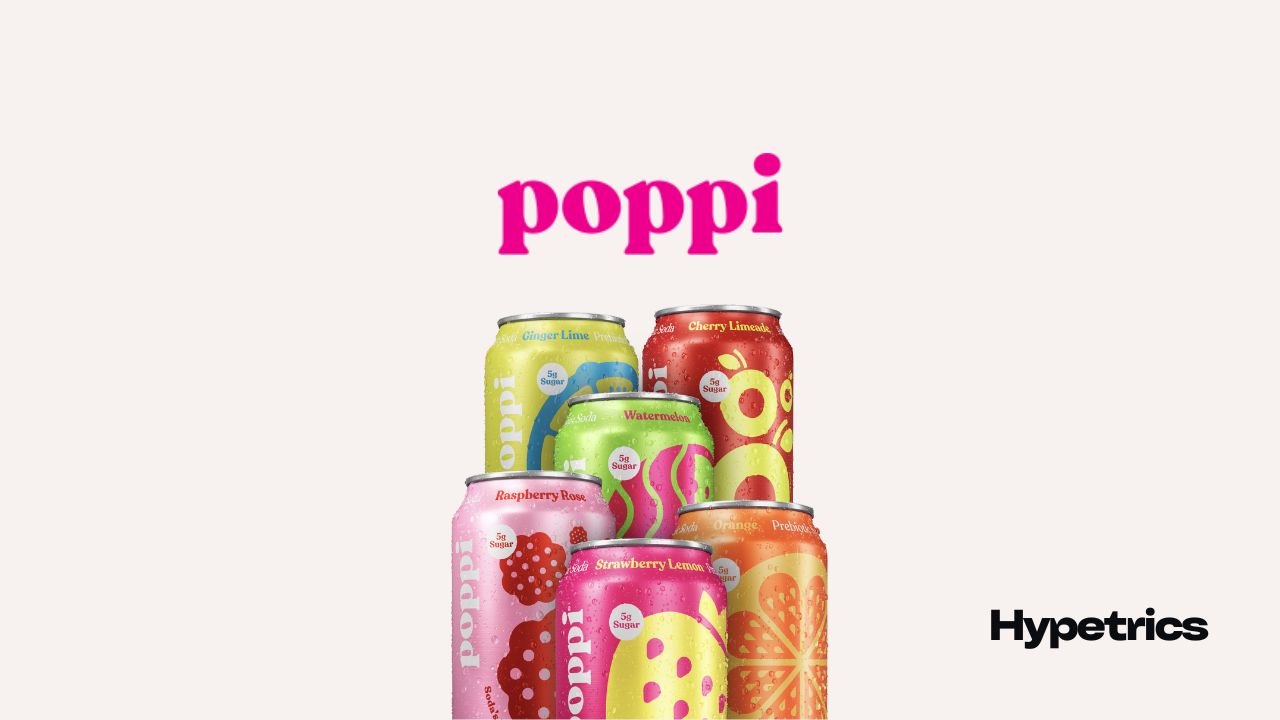
PepsiCo Expands Portfolio, Acquires Prebiotic Soda Brand Poppi for $1.95 Billion Hypetrics Desk March 23, 2025
Deconstructing Emergent: The Complete Institutional Report on the AI-Native App Engine Hypetrics Desk July 28, 2026
Deconstructing Emergent: The Complete Institutional Report on the AI-Native App Engine Hypetrics Desk
The Hard Engineering Stack: Deconstructing LAT Aerospace’s Triple-Program Architecture Hypetrics Desk
The Technical Infrastructure Index: Benchmarking Precision Engineering, Localized Tooling, and Capital Optimization Models Hypetrics Desk
NZXT strategies distribution in India along with Redington India and Technology & Gadgets (TAG). Hypetrics Desk
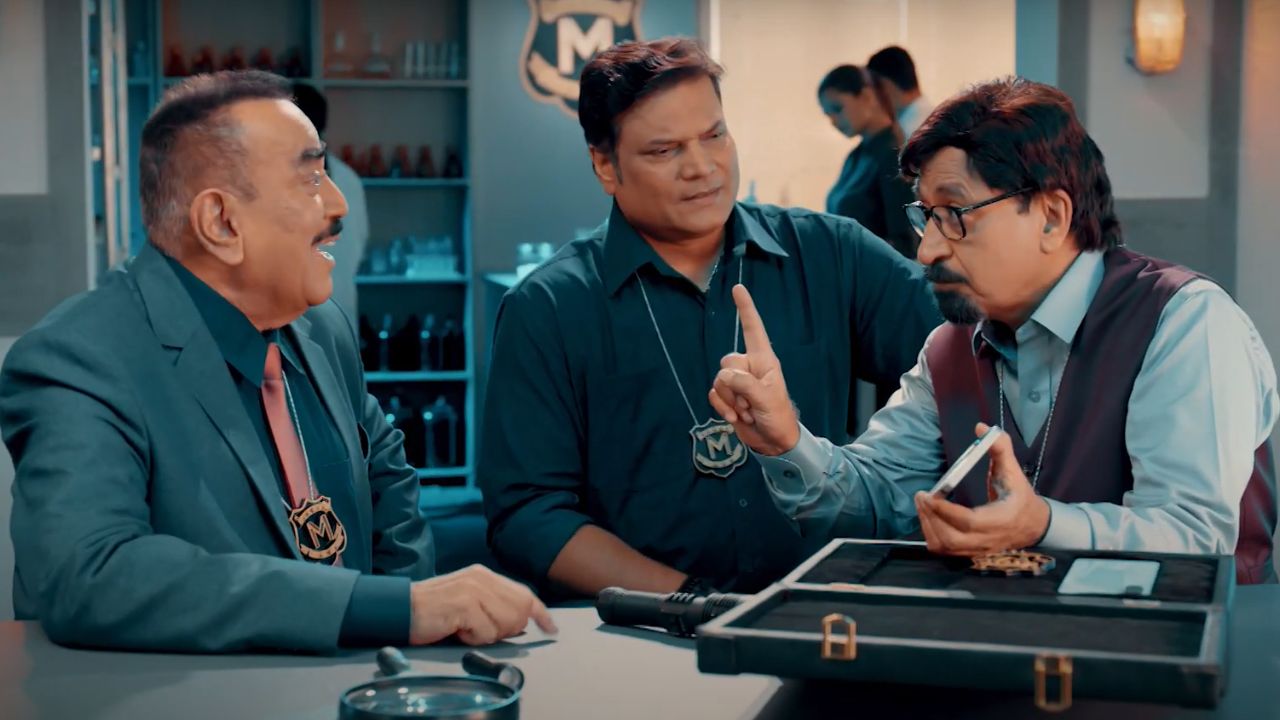
Samsung joins forces with CID to unleash the ultimate Monster- Samsung Galaxy M series. March 30, 2025
Zepto makes a dazzling debut on TV advertisement for its super saver campaign, starring Akshay Kumar and Jr. NTR March 15, 2025
‘Fashion ki Adalat’ Myntra’s bold move on women’s day, Redefining fashion standards with Archana Puran Singh. March 15, 2025
Britannia marigold honours Avani Lekhra ‘India’s supergal’ with a special edition biscuits, a tribute to celebrate her iconic win. March 8, 2025
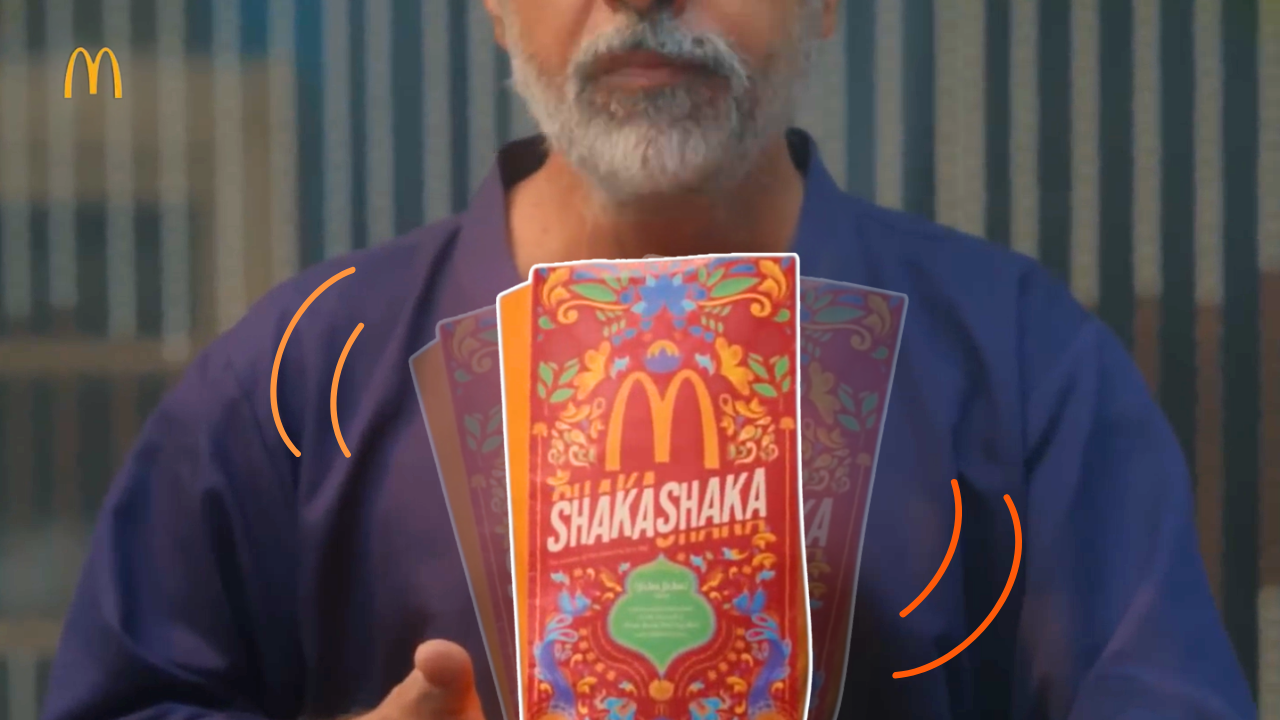
Shaka Shaka! : McDonald’s unique way of Assembling Gen-Z to join the journey through divine vibration of cosmos. The sacred rhythm crafted by their new shaker fries. March 8, 2025
Deconstructing Emergent: The Complete Institutional Report on the AI-Native App Engine Hypetrics Desk July 28, 2026
Deconstructing Emergent: The Complete Institutional Report on the AI-Native App Engine Hypetrics Desk
The Hard Engineering Stack: Deconstructing LAT Aerospace’s Triple-Program Architecture Hypetrics Desk
The Technical Infrastructure Index: Benchmarking Precision Engineering, Localized Tooling, and Capital Optimization Models Hypetrics Desk
The Real Economics of AI Startup Cost in India: What Building an AI Company Actually Takes Hypetrics Desk November 25, 2025
Tourism Momentum Accelerates as India Builds a Multi Trillion Rupee Growth Engine Hypetrics Desk November 22, 2025
Steady Rise in India’s Automobile Exports Shows the Sector’s Growing International Confidence Hypetrics Desk November 21, 2025